|
|
| 
|
| |
| |
|
| |
|
Alexandria's
Services
Design
of Experiment - Mixture Design
Designed
experiments refer to the analysis of data collected
when cause factors have been varied in a deliberate,
planned manner. When performing a designed experiment,
the quality of the results is determined primarily before
the experiment is actually performed. A particular type
of designed experiments is termed mixture designs and
is used when the objective is to formulate a recipe
from a mixture of ingredients. Design points based on
proportional combinations of the ingredients are determined
in such a way to map the experimental region. At each
design point, the appropriate recipe is mixed and measured
responses are recorded. The responses may be highly
quantitative and physical in nature, such as cost, viscosity,
or immiscibility or may be more qualitative in nature,
such as preference ratings for color, smell, or texture.
When the design point combination responses are recorded,
models are derived that plot contour maps showing optimal
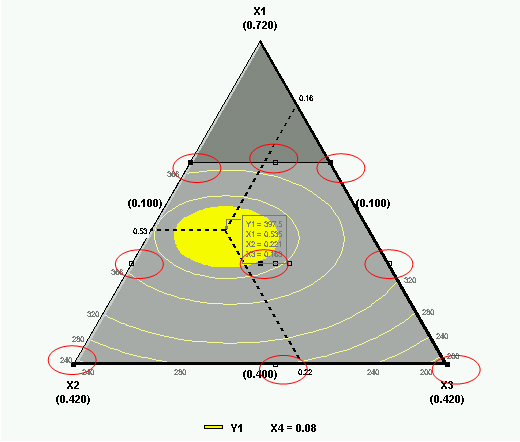
areas for analyzed responses. In the mixture region
picture, 4 ingredients (X1, X2, X3, X4) are combined
at design points that map the light gray area. The yellow
contour lines show values of the response, for example
smell preference. The yellow oval designates the area
where the response is the highest value. At the selected
point, designated by the cross-hairs, the model predicts
the smell preference of the recipe of X1=53.5%, X2=22.1%,
X3=16.3%, X4=8%, to be the highest at 397.5. The red
circled points are the design points. From a small number
of experiments (in the case of this example, 17) an
optimal value may be obtained extremely efficiently.
The guesswork of formulation is removed! No more is
the laboratory testing a recipe and then deciding which
way to experiment next based on the results of the last
run. One of our clients estimates he saved
9 months of laboratory work by using this modeling
process. Call Alexandria today to save valuable product
development time.
|
|
|
Figure
1 : Mixture Design/Design of Experiments |
|
|
|
|
Design
of Experiment - Factorial Design
Factorial
Designed Experiments are used when independent or causal
variables are tested for effect on dependent variables
or responses. Causal variables have multiple levels
and are varied in deliberate combinations with each
other whereupon responses are measured. Factorial designs
predict individual variable effects as well as interacting
effects. Experimentation without the use of factorial
designs is typically a “one factor at a time “
or FAT approach and can consume your research and development
budget quickly. Consider the researcher who wants to
find which of 8 factors, each of 2 levels, are effecting
response values of interest. With a one factor at a
time approach, the researcher would set all 8 factors
at the first level, measure the responses, then move
the first factor to the second level while fixing all
other factors and measure the responses. Proceeding
with this method, the researcher would need 16 consecutive
runs of the material to measure the differences in factor
effects and would have no information on the interaction
effects. With a factorial design, varying all 8 factors
in a planned method, simultaneously, 16 runs would not
only separate the 8 factor effects but would also determine
7 interaction effects, something that cannot be measured
with a one at a time approach. The efficient use of
planned experimentation can accelerate the researcher
up the knowledge curve. Termed DOE, design of experiment
saves time and money in product design and product failure
evaluation.
|
|
|
|
Figure
2: Factorial Design/Design of Experiments |
|
|
|
FAT
Approach |
DOE
Approach |
|
|
|
|
|
|
|
|
|
|
|
|
|
|
|
|
| |
|